Austin Cap Rates in 2026: What Investors Need to Know Before Buying
Where Austin cap rates stand in 2026, how to calculate them, and the underwriting mistakes that sink deals. A practical guide from a local investment broker.
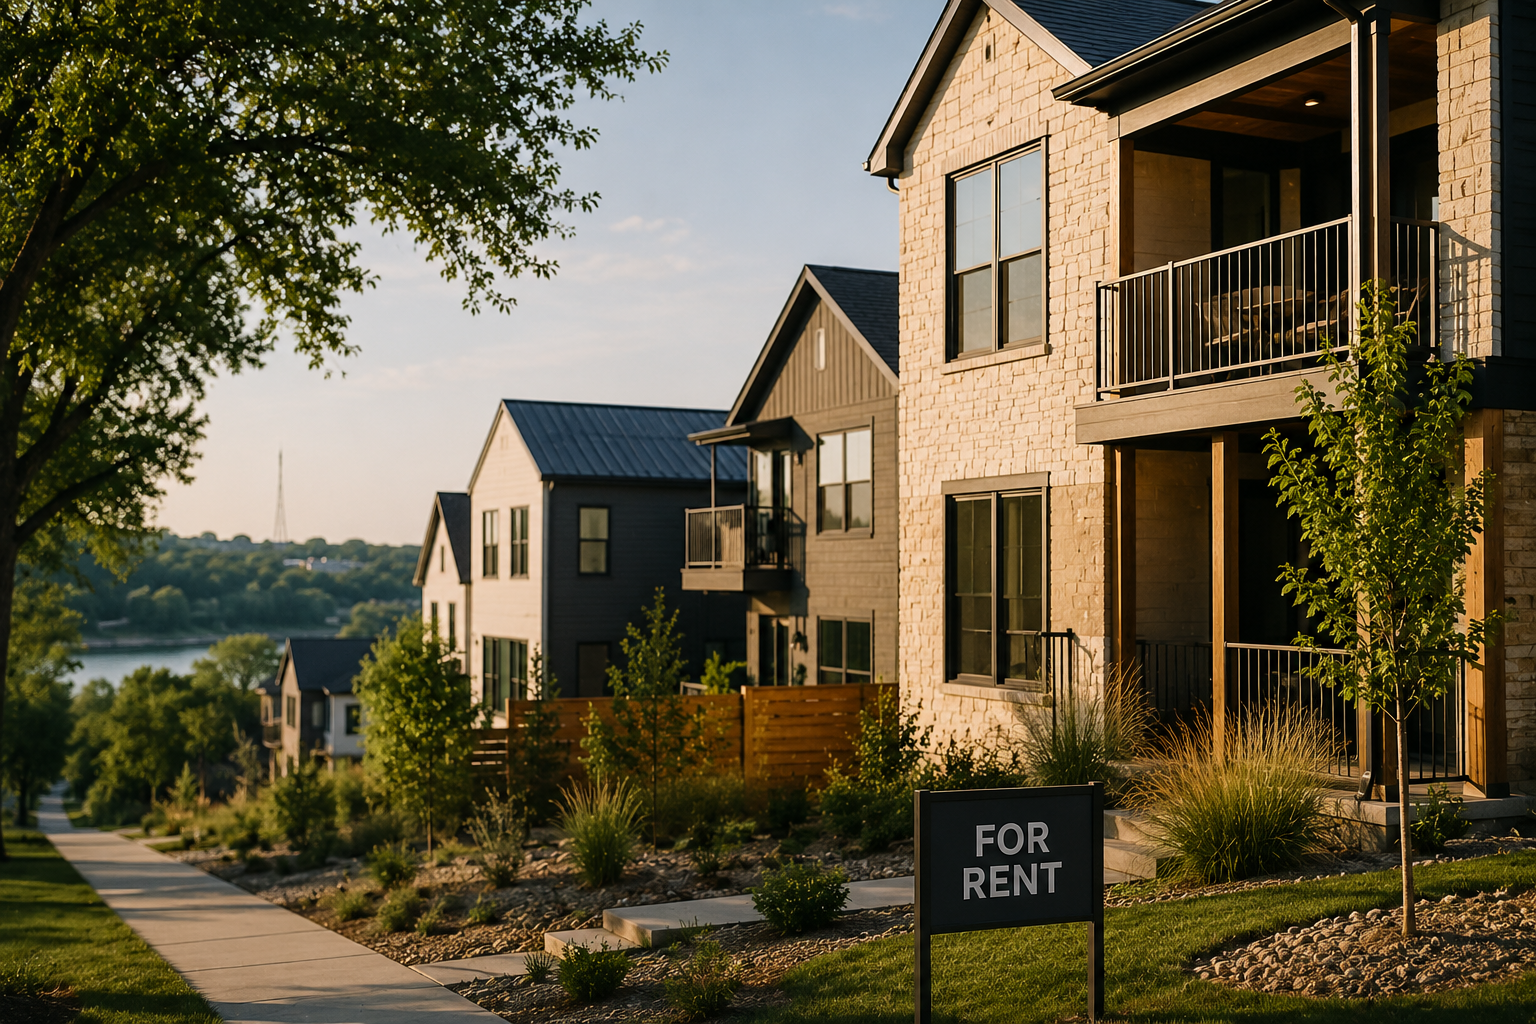
Austin cap rates opened 2026 in a 5.5% to 6.5% band. The range is where the analysis starts, not where it ends.
Cap rates are one of the most cited metrics in real estate investing, and also one of the most misunderstood. Investors throw the number around in conversations about Austin properties as if it settles the question of value. It doesn't. It opens the conversation.
Here is the short answer most readers came for: as of early 2026, most Austin multifamily assets are trading at cap rates between 5.5% and 6.5%, with the metro-wide market cap rate sitting near 5.7%. Stabilized Class A product prices toward the bottom of that range, Class B and C value-add deals toward the top, and office and retail trade wider to compensate for vacancy risk. If you want to know what those numbers actually mean for your next acquisition, keep reading, because the range is where the analysis starts, not where it ends.
A cap rate tells you the relationship between a property's income and its price. That's genuinely useful information. But it tells you nothing about how the asset was financed, what rents might do over the next three years, or whether the expenses in the seller's pro forma are remotely accurate. In a market like Austin, where submarket dynamics shift at the neighborhood level and property taxes are among the highest in the country, those details matter as much as the formula itself. Our Austin property taxes explained primer is a good companion read for the tax side of the underwrite.
Austin's investment market has matured considerably. The days of buying anything in the metro and watching appreciation cover every underwriting mistake are behind us. Investors operating here now need to think more carefully about yield, risk, and the specific conditions of each submarket. That requires a working understanding of cap rates, not just the ability to calculate one. For a broader view of how these deals fit within the current market, see our Austin real estate investment overview and the invest with Echelon Property Group service page.
This article is written for investors who are actively evaluating Austin properties, or who are getting close to that point. Whether you're looking at a small multifamily asset in East Austin, a mixed-use building along South Congress, or a suburban rental portfolio in Round Rock or Cedar Park, the framework here applies. We'll cover where Austin cap rates stand right now, how the metric works, where it falls short as a decision-making tool, and how to use it alongside the metrics that actually drive investment returns.
The goal isn't to give you a formula. It's to give you a sharper lens for reading the Austin market. For a direct read on current conditions from a local investment broker, you can also reach Taylor Sherwood directly.
How Cap Rates Work: The Formula Is Simple, the Interpretation Is Not
Cap rate stands for capitalization rate. The calculation itself is straightforward: divide a property's Net Operating Income by its purchase price, and express the result as a percentage.
Here's a clean example. Imagine an Austin duplex generating $48,000 in annual gross rent. After accounting for property taxes, insurance, maintenance, property management fees, and a reasonable vacancy allowance, the net operating income comes to $36,000. If the purchase price is $600,000, the cap rate is 6%. That's it.
What makes cap rate particularly useful is what it excludes: your mortgage. Cap rate is calculated before debt service, which means it's financing-neutral. Two investors can look at the same property, one paying cash and one using a loan, and they're both working with the same cap rate. That makes it a clean apples-to-apples comparison tool across properties, regardless of how each buyer structures their financing.
What Counts in NOI (and What Doesn't)
NOI deserves a closer look, because this is where deals often get distorted. Gross rental income minus operating expenses gives you NOI. Operating expenses include property taxes, insurance, routine maintenance, property management, and a vacancy allowance. What NOI does not include: mortgage payments, depreciation, or income taxes. Those are financing and accounting decisions, not property-level income metrics.
Texas property taxes are worth flagging here specifically. Because Texas has no state income tax, it funds local government primarily through property taxes, and rates across the Austin metro are among the highest in the country. This meaningfully affects NOI on Austin investment properties. An investor underwriting a deal in Travis County or Williamson County needs to model property taxes carefully, because they represent a significant operating expense that can shift the cap rate materially if underestimated. Our Texas homestead exemption guide covers the owner-occupied side of that same tax structure.
High vs. Low Cap Rates: Neither Is "Better"
Now, the core tension that every investor needs to internalize: a lower cap rate signals higher perceived value or lower risk. A higher cap rate signals either better yield or higher risk. Neither direction is inherently better.
A stabilized, well-located multifamily asset in a high-demand Austin corridor might trade at a low cap rate because buyers are confident in rent growth, occupancy, and long-term appreciation. That compressed yield reflects competitive demand. On the other hand, a higher cap rate on an older commercial building with a short-term lease and deferred maintenance might look attractive on paper but signals real risk. The number alone doesn't tell you which situation you're in. Context does.
Where Austin Cap Rates Stand in 2026
Numbers first, caveats second.
Austin's multifamily investment market opened 2026 with its strongest first quarter since 2022. Investment sales data from first-quarter Austin reports shows cap rates stabilized in the 5.5% to 6.5% range, with institutional buyers accounting for roughly three quarters of transaction volume and a median price near $193,000 per unit. The overall market cap rate sits at 5.7%, against a backdrop of 13.5% vacancy and average asking rents near $1,500 per unit. Translation: yields are meaningfully higher than the prior cycle's peak pricing, and capital is transacting again. Our live Austin luxury market report and ongoing market intelligence briefings track how these figures move quarter over quarter.
- Stabilized Class A multifamily: lower end of the 5.5% to 6.5% band. Institutional demand is back, but lease-up concessions are still common.
- Class B and C multifamily: mid to upper end of the band. The heaviest transaction activity, with North Austin Class C leading the sales mix.
- Value-add multifamily: upper end of the band and above. Priced off stabilized NOI assumptions, which means execution risk is priced in.
- Office and retail: wider and higher than multifamily. Elevated vacancy and leasing risk demand a yield premium. See our Austin commercial real estate overview for the sector detail.
- Single-family rentals: typically below comparable small multifamily yields in core submarkets. Land value and owner-occupant demand support pricing beyond the income.
- Short-term rentals: not directly comparable on a headline cap rate. Revenue volatility and regulatory risk require normalized underwriting.
Two things about this snapshot matter for anyone writing offers this year.
First, price discovery has largely happened in multifamily. The post-2022 standoff between sellers anchored to old valuations and buyers facing expensive debt has mostly resolved, at least in residential income assets. Deals are clearing at cap rates that reflect current conditions.
Second, the forward setup is shifting. The supply wave that pressured rents and NOI is thinning fast: new deliveries in Austin are projected to fall by nearly half in 2026, and first-quarter absorption outpaced new completions. Most national outlooks call for multifamily cap rates to hold stable this year with incremental compression to follow as fundamentals recover. None of that is a guarantee. It is a setup, and setups reward investors who underwrite carefully rather than optimistically. Our Austin luxury inventory trends coverage tracks the residential side of the same supply story.
One more caveat that matters more in Austin than in most markets: these are metro-level figures. A stabilized asset in Mueller and a heavy value-add play off Rundberg are not priced off the same expectations, and the spread between submarkets is often wider than the spread between asset classes.
Austin Cap Rates by Asset Class
Cap rates in Austin vary significantly depending on what you're buying. Multifamily, single-family rentals, small commercial, mixed-use, and short-term rental assets each carry different investor expectations, different risk profiles, and different income stability characteristics. Treating them as comparable on cap rate alone is a mistake.
Multifamily
Multifamily has historically attracted institutional capital to Austin, which tends to compress cap rates on stabilized assets. Institutional buyers underwrite aggressively in markets with strong population growth and diversified employment, and Austin has offered both. The presence of major tech employers, UT Austin, and a steady stream of corporate relocations has supported long-term demand for rental housing across the metro.
Single-Family Rentals
Single-family rentals operate in a different part of the market. They're more often owned by individual investors and smaller operators, and they tend to carry different cap rate expectations. Management intensity, turnover costs, and the difficulty of scaling single-family portfolios affect how buyers price these assets.
Small Commercial and Mixed-Use
Small commercial and mixed-use properties, particularly along corridors like South Congress, East Cesar Chavez, or the Domain area in North Austin, involve a more complex income analysis. Retail and office tenants carry different lease structures, credit quality, and vacancy risk than residential tenants. Post-pandemic, Austin's office market has seen meaningful vacancy increases, which adds another layer of uncertainty to commercial underwriting. Investors evaluating ground-up or repositioning plays should also review our Austin land development opportunities guide.
Short-Term Rentals
Short-term rental properties, particularly in central Austin and the surrounding Hill Country, have a distinct income profile. Gross revenue can be significantly higher than long-term rental income, but volatility is also higher. Regulatory risk matters here too: Austin has implemented short-term rental regulations, and those rules affect how investors should underwrite STR income. Treating short-term rental revenue as stable is an underwriting mistake many investors have made.
How Austin Submarkets Move the Number
Submarket location shapes cap rate expectations as much as asset class does. An East Austin duplex, a South Congress mixed-use building, and a Round Rock multifamily asset are all Austin-area investments, but they attract different buyer profiles and carry different yield expectations. East Austin commands premium pricing driven by proximity to urban amenities and strong rental demand. Round Rock and Cedar Park, further out in Williamson County, often carry different cap rate profiles because buyers are underwriting a different risk and appreciation profile, even if the income looks similar on paper.
Mueller, the redeveloped airport site near central Austin, attracts buyers who are underwriting a specific community dynamic and long-term appreciation story. The Domain area in North Austin has become a de facto second downtown, with multifamily and mixed-use assets priced accordingly. These aren't interchangeable submarkets, and cap rate analysis that ignores location context is incomplete.
Austin has historically offered compressed cap rates compared to secondary and tertiary markets because investors have been willing to accept lower current yield in exchange for appreciation potential. That trade-off is real, but it requires careful thinking about how much appreciation you need to make the deal work, and whether current market conditions still support that expectation.
Why Austin Cap Rates Shifted After 2022
The period from 2022 onward created a meaningful disruption in Austin's investment market, and cap rates were at the center of it. The Federal Reserve's rate increases pushed borrowing costs up sharply, and that created a problem specific to markets like Austin where cap rates had been compressed by competitive demand: negative leverage.
The Negative Leverage Problem
Negative leverage occurs when the cap rate on a property is lower than the interest rate on the debt used to finance it. When debt costs more than the property yields on an unlevered basis, adding financing actually reduces the investor's equity return rather than enhancing it. In markets where cap rates had been driven down by strong demand and appreciation expectations, rising debt costs exposed that structural vulnerability.
For Austin investors, this created a real pricing problem. Sellers who had bought or valued assets based on a low-rate environment were reluctant to reprice. Buyers who needed financing to make deals work were unwilling to accept negative leverage. The result was a widening bid-ask spread, particularly in multifamily and commercial assets, and a slowdown in transaction volume as price discovery became difficult.
Institutional buyers, who had been active in Austin's multifamily market, recalibrated their underwriting. Return thresholds that had been met in a low-rate environment no longer penciled at the same price points. Some deals that would have traded in prior years simply didn't transact, or traded at meaningful discounts from prior peak valuations.
Austin's Supply Wave
Austin's multifamily market had an additional supply-side dynamic that national cap rate data doesn't capture. The city saw a significant construction pipeline in the early-to-mid 2020s, adding substantial new inventory across multiple submarkets. In areas where new supply came online in volume, rent growth slowed or reversed in some cases, affecting the NOI projections that buyers were underwriting. An investor relying on aggressive rent growth assumptions to justify a low going-in cap rate was taking on more risk than the headline number suggested.
This is a locally specific dynamic. National multifamily data may show one trend, but the experience in North Austin near the Domain, or in suburban submarkets like Pflugerville and Kyle, could look quite different depending on how much new supply arrived and how quickly it was absorbed. As covered above, that pipeline is now thinning sharply, which is a core reason the 2026 data looks more like recalibration than distress.
The post-2022 environment has been a period of recalibration, not collapse. Austin's underlying demand drivers remain intact. Employment, population growth, and in-migration have continued to support the market. But the easy underwriting of the prior cycle is behind us, and investors who understand how cap rates interact with borrowing costs are better positioned to find deals that actually work.
What a Cap Rate Won't Tell You
Cap rate is a snapshot of current income relative to current price. It is not a forecast, and treating it like one is one of the more common mistakes investors make when evaluating Austin properties.
The metric reflects what a property is generating today, or in the trailing twelve months, depending on what the seller provides. It says nothing about what rents will do next year, whether vacancy is trending up or down, or what capital expenditure needs are sitting beneath the surface. An older property with deferred maintenance might show a strong cap rate based on current income, but if the roof, HVAC systems, or plumbing need significant work, the actual return picture is very different.
Going-In vs. Stabilized Cap Rates
The distinction between going-in cap rate and stabilized cap rate is critical for value-add deals, and Austin has no shortage of value-add opportunities. A going-in cap rate reflects the property's current income, which on a value-add asset is typically below market because of below-market rents, high vacancy, or deferred maintenance. The stabilized cap rate reflects what the asset should yield once it's been repositioned to market occupancy and rents. The gap between those two numbers is where the value-add thesis lives, but it's also where projections can be optimistic.
Investors evaluating value-add plays in East Austin or other transitional neighborhoods need to stress-test the stabilized NOI assumptions carefully. What's the realistic rent after renovation? How long will lease-up take? What are the actual renovation costs? A deal that looks compelling on a projected stabilized cap rate can underperform significantly if any of those assumptions are off.
Pro Forma vs. Trailing NOI
Pro forma versus trailing NOI is another critical distinction. Sellers often present pro forma financials that reflect projected income at market rents and full occupancy. That's a forward-looking number, not a verified one. Trailing NOI is what the property has actually generated. Both are useful, but they answer different questions, and conflating them is a meaningful underwriting error.
The Off-Market Due Diligence Trap
Off-market Austin deals carry additional due diligence risk. When a property is sold quietly without broad market exposure, third-party verification of income and expenses is limited. Expense underreporting, whether intentional or simply the result of an owner who self-manages and doesn't account for their own time, can inflate the apparent NOI and make a deal look better than it is. Independent due diligence, including a review of actual tax returns, utility bills, and maintenance records, is essential before relying on any cap rate presented by a seller of an off-market property.
Cap Rate vs. Cash-on-Cash Return and Other Metrics That Matter
Cap rate is most useful when it's part of a broader analytical framework. On its own, it answers one question: what yield does this property produce on an unlevered basis? To make an informed investment decision, you need to answer several more.
Cash-on-Cash Return
Cash-on-cash return is the metric that accounts for financing, and in an environment where borrowing costs are elevated, it's arguably the more important number for most investors. Cash-on-cash measures the actual cash income generated on the actual cash invested, after debt service. Two properties with identical cap rates can produce very different cash-on-cash returns depending on how much leverage is used and at what interest rate. If you're financing an Austin acquisition at current rates, the cash-on-cash return is the number that tells you whether the deal actually works for your equity.
This is where the negative leverage problem becomes concrete. A property with a cap rate below the prevailing debt cost will show a cash-on-cash return lower than the cap rate, meaning the more you borrow, the worse your equity yield gets. Understanding that dynamic before you make an offer is essential.
Appreciation and Total Return
Appreciation potential is the other major variable that cap rate ignores, and it's particularly relevant in Austin. Investors in high-growth corridors, whether that's along the light rail expansion, near major employment centers, or in transitional neighborhoods experiencing gentrification, are often underwriting total return rather than just income yield. They're accepting a compressed cap rate because they expect appreciation to carry a meaningful portion of the overall return.
That's a legitimate strategy, but it requires discipline. The appreciation assumption needs to be grounded in specific market drivers, not general optimism about Austin. What's the infrastructure investment in the area? What are employment trends doing? Is new supply constrained? These questions give the appreciation thesis a foundation. And if appreciation is a core part of your thesis, your exit planning matters as much as your entry: understanding tools like the 1031 exchange for Texas investors, which lets you roll gains into the next asset and defer the tax bill, should be part of the underwriting from day one.
Gross Rent Multiplier
Gross Rent Multiplier, or GRM, is a quick screening tool that works well for residential income properties. It's calculated by dividing the purchase price by the annual gross rent. It's less precise than cap rate because it doesn't account for expenses, but it's faster to calculate and useful for initial screening when you're evaluating multiple properties. GRM works best as a first filter, not a final underwriting tool.
Matching the Metric to the Strategy
The right metric depends on your strategy and hold period. An investor focused on current income needs cash-on-cash return. A long-term hold investor underwriting appreciation needs total return analysis. A quick screening pass across a list of properties might start with GRM. Cap rate fits into all of these frameworks, but it doesn't replace them. Investors building a real estate portfolio in Austin benefit from applying all of these tools together rather than relying on any single metric. If you want a working template calibrated to your target return, Taylor Sherwood can walk through it directly.
Reading the Austin Market Through a Cap Rate Lens
Cap rate trends reveal something important about market sentiment: where buyers and sellers are finding agreement, and where they're not. In Austin's current environment, the bid-ask spread remains wider in some asset classes than others, and understanding that dynamic helps investors focus their attention on segments where transactions are actually happening.
The office and retail sectors continue to present complex cap rate analysis. Austin's office market has seen significant vacancy increases since the pandemic, and that affects both current NOI and investor confidence in future income stability. Buyers in those sectors are requiring higher cap rates to compensate for leasing risk, while sellers who bought at lower cap rates in prior cycles are often reluctant to accept the repricing. The result is limited transaction activity in some segments.
Land values in high-growth Austin corridors create a structural dynamic worth understanding. When land is expensive relative to income, the cap rates on existing income properties in those areas get compressed because the underlying land value supports the price even when current income doesn't fully justify it. Investors who recognize this sometimes look at land and highest-and-best-use analysis as an alternative to buying existing income properties at compressed yields. If the income return isn't there, but the land appreciation story is compelling, the investment thesis shifts accordingly. Our Austin land development opportunities coverage walks through where that math is currently working.
A practical framework for approaching cap rate analysis in Austin before making an offer: start by establishing your target return, both on an unlevered and levered basis. Then model your financing assumptions at current rates, not optimistic future rates. Stress-test the NOI by questioning every income and expense line item, and build in a vacancy allowance that reflects actual submarket conditions rather than seller projections. Finally, understand what appreciation assumption, if any, is embedded in the deal, and whether that assumption is supported by specific, identifiable market drivers.
That process won't guarantee a good deal, but it will keep you from making a bad one based on a number that only tells part of the story.
Austin Cap Rate FAQ
The Bottom Line on Austin Cap Rates
Cap rates are a starting point, not a conclusion. They give you a way to compare properties on a common basis, and they reveal something real about how the market is pricing risk and yield at a given moment. But they don't tell you whether the income is accurate, whether the property will appreciate, or whether the deal works with your specific financing structure.
In Austin, that nuance matters more than in simpler markets. The metro spans multiple distinct submarkets with different demand drivers, supply conditions, and investor profiles. Property taxes are a significant expense that affects NOI materially. The post-2022 rate environment complicated the leverage math that many investors had relied on. And the city's growth story, while real, requires careful analysis rather than assumption.
Investors who do well in Austin's market tend to share a few characteristics: they understand their target return before they start looking, they verify income and expenses independently rather than accepting seller presentations at face value, and they have a clear view of which submarkets align with their strategy.
They also tend to have access to deal flow and market intelligence that isn't always visible in public listings. Off-market opportunities, submarket-specific data, and relationships with operators and owners are often what separate a good acquisition from a missed one.
If you're evaluating investment opportunities in Austin and want a second set of eyes on the underwriting, Echelon Property Group works with investors across multifamily, residential income, and commercial assets throughout Travis, Williamson, and Hays counties. Learn more about our investment services and Austin real estate investment practice, or reach out to Taylor Sherwood directly to talk through a specific deal.
Continue Exploring
Three places to go from here

ABOUT THE AUTHOR
Taylor Sherwood
Austin Real Estate Advisor · Echelon Property Group
Taylor Sherwood is a Certified Luxury Home Marketing Specialist (CLHMS) and top-performing Austin real estate advisor. He specializes in luxury residential properties, land development, commercial real estate, and investment property across Austin and the Texas Hill Country. With deep market expertise and a results-driven approach, Taylor helps buyers, sellers, and investors navigate Austin's most competitive real estate segments.
Related Reading

Cost Segregation and 100% Bonus Depreciation for Austin Investors: The 2026 Playbook
100% bonus depreciation is permanent. What a cost segregation study does on a $1M Austin STR and an 8-unit, who can use the loss, and what recapture costs.
2026-08-26 • 22 min read

Austin ADU Rules in 2026: What HOME Lets You Build, What It Costs, and When the Math Actually Works
Austin ADU rules under the HOME initiative in 2026: what you can build, what it costs, what it rents for, and a worked investor model that shows when the math works.
2026-08-07 • 16 min read

Austin Short-Term Rental Rules in 2026: The Investor's Guide to the New Ordinance, the License Math, and the Shakeout Ahead
Austin rewrote its STR ordinance. License costs, the July 1 platform crackdown, real revenue data from four sources, and a full worked underwrite for investors.
2026-07-31 • 14 min read

Where Austin Homeowners Are Actually Moving in 2026, and How Investors Should Trade It
Travis County just posted its first population decline in over 20 years. County-by-county migration data, the $992/month carrying-cost arbitrage, and four investment theses.
2026-07-28 • 11 min read