Austin Home Prices by ZIP Code (October 2026)
Median sale price, price per square foot, days on market and inventory for 72 Austin-area ZIP codes, trailing 12 months to Sept 30, 2026. Updated quarterly.
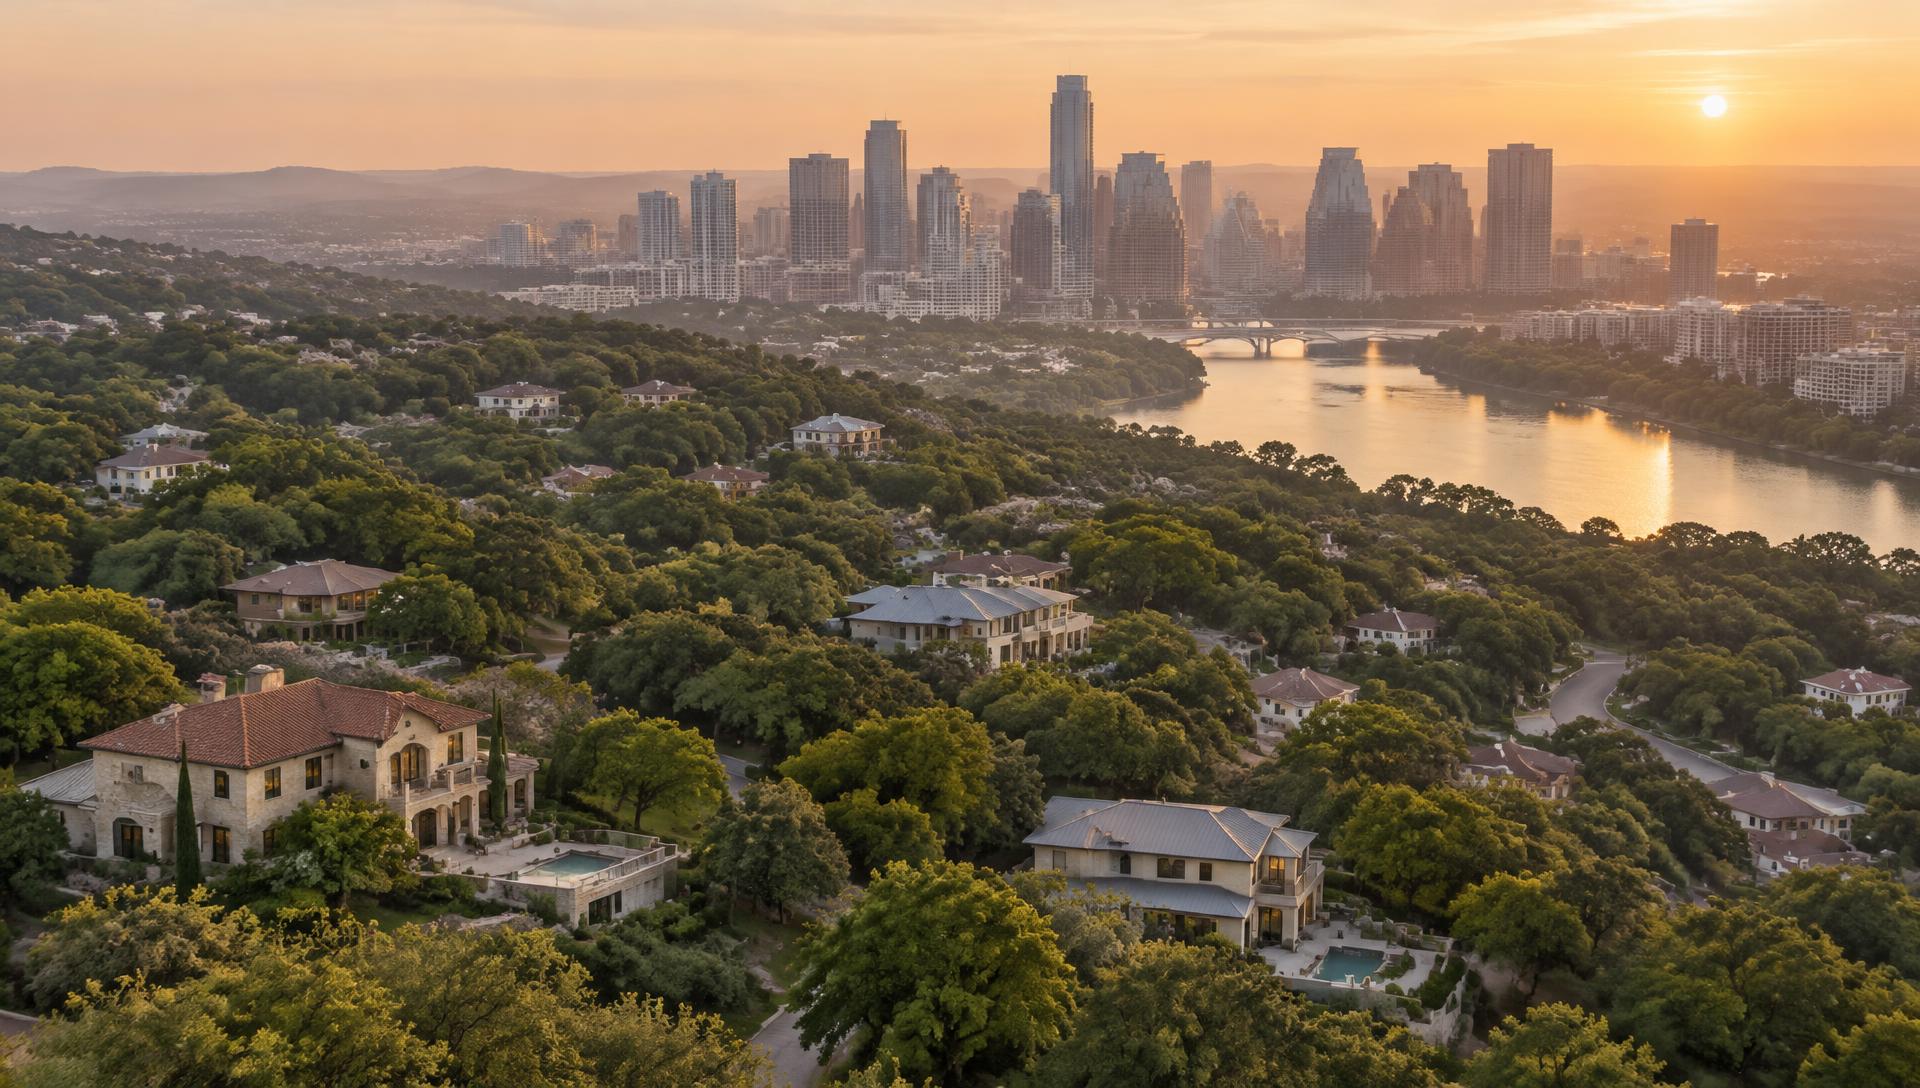
Median price, price per square foot, days on market and months of inventory for 72 ZIPs, trailing twelve months through September 30, 2026
Data through September 30, 2026. Updated October 16, 2026. Next refresh January 2027.
In this guide
- Austin home prices by ZIP code: the full table
- Price per square foot by ZIP: the league table
- West Austin and the luxury core
- Central and East Austin
- North, Northwest, South and Southwest Austin
- Commuter suburbs: Williamson, Hays, Bastrop and the lake towns
- How to read the numbers
- What the data says for buyers and sellers, by price tier
- Methodology and data notes
- Frequently asked questions
All ZIP figures are trailing twelve months, October 1, 2025 through September 30, 2026, all residential property types, via Agent Intel. The full table of 72 ZIPs follows.
Austin home prices by ZIP code: the full table
Every Austin-area ZIP with enough closed sales to report, ranked by median sale price. Sale-to-list is the median closed price as a share of final asking price. One-year change compares the median against the prior twelve months. Source: Agent Intel housing dataset, all residential segments, October 1, 2025 through September 30, 2026.
| 1 | 78746 | Westlake Hills, Rollingwood, Lost Creek | $1,869,828 | $560 | 87 | 5.3 | 95.1% | +10.0% |
| 2 | 78733 | Davenport Ranch, Cuernavaca, Austin Lake Hills | $1,289,268 | $421 | 50 | 5.0 | 95.8% | +4.1% |
| 3 | 78703 | Tarrytown, Pemberton Heights, Clarksville | $1,274,281 | $602 | 69 | 6.9 | 95.0% | -7.7% |
| 4 | 78730 | River Place, Glenlake, Long Canyon | $1,170,036 | $345 | 64 | 5.0 | 96.5% | -5.3% |
| 5 | 78731 | Northwest Hills, Cat Mountain | $1,084,668 | $403 | 69 | 4.1 | 96.0% | -2.9% |
| 6 | 78619 | Driftwood | $1,009,056 | $313 | 93 | 8.9 | 96.9% | -5.9% |
| 7 | 78738 | Bee Cave, Spanish Oaks, Lakeway south | $884,524 | $280 | 70 | 4.4 | 96.9% | +6.8% |
| 8 | 78737 | Belterra, Highpointe (SW Austin) | $844,314 | $273 | 75 | 3.8 | 97.5% | +5.0% |
| 9 | 78735 | Barton Creek, Travis Country | $824,439 | $366 | 67 | 4.2 | 96.3% | -7.1% |
| 10 | 78704 | Zilker, Bouldin, Travis Heights, South Congress | $822,692 | $492 | 90 | 7.0 | 96.1% | -7.2% |
| 11 | 78739 | Circle C Ranch, Shady Hollow | $807,940 | $295 | 45 | 2.4 | 98.6% | +5.3% |
| 12 | 78732 | Steiner Ranch | $807,435 | $266 | 90 | 5.7 | 96.5% | -6.5% |
| 13 | 78756 | Rosedale, Allandale south | $724,952 | $468 | 64 | 4.5 | 96.9% | -11.8% |
| 14 | 78757 | Crestview, Allandale, Brentwood | $713,326 | $432 | 62 | 5.0 | 96.7% | +6.9% |
| 15 | 78726 | Four Points, Canyon Creek | $689,152 | $248 | 66 | 4.5 | 97.2% | -1.6% |
| 16 | 78702 | East Austin, Holly, Govalle | $681,202 | $457 | 71 | 8.2 | 96.5% | -2.1% |
| 17 | 78759 | Great Hills, Arboretum | $655,961 | $327 | 58 | 3.7 | 97.2% | +2.1% |
| 18 | 78734 | Lakeway, Hudson Bend | $651,452 | $275 | 87 | 7.8 | 96.2% | -5.2% |
| 19 | 78751 | Hyde Park, North Loop | $643,080 | $455 | 90 | 6.6 | 96.7% | -3.1% |
| 20 | 78669 | Spicewood | $637,454 | $262 | 125 | 10.9 | 95.7% | -5.0% |
| 21 | 78701 | Downtown (condos) | $636,082 | $676 | 102 | 12.2 | 95.2% | -5.5% |
| 22 | 78620 | Dripping Springs | $610,875 | $244 | 89 | 5.7 | 97.0% | -1.6% |
| 23 | 78717 | Avery Ranch, Brushy Creek | $608,069 | $231 | 66 | 4.4 | 97.5% | +7.1% |
| 24 | 78750 | Anderson Mill, Jollyville | $605,486 | $279 | 61 | 3.5 | 97.2% | +0.6% |
| 25 | 78722 | Cherrywood, French Place | $583,567 | $436 | 94 | 5.3 | 95.1% | -7.8% |
| 26 | 78749 | Legend Oaks, Western Oaks, Oak Hill east | $573,833 | $290 | 49 | 3.0 | 98.5% | +0.1% |
| 27 | 78723 | Mueller, Windsor Park | $558,510 | $355 | 74 | 5.6 | 97.3% | -4.2% |
| 28 | 78676 | Wimberley | $547,764 | $272 | 107 | 8.9 | 95.9% | +15.5% |
| 29 | 78736 | West Oak Hill, Bee Creek | $517,449 | $278 | 63 | 4.3 | 97.0% | -9.6% |
| 30 | 78642 | Liberty Hill | $507,682 | $195 | 121 | 5.8 | 97.3% | +2.3% |
| 31 | 78628 | Georgetown west, Wolf Ranch | $502,573 | $204 | 106 | 5.3 | 97.3% | -0.7% |
| 32 | 78681 | Round Rock west, Brushy Creek | $486,929 | $214 | 65 | 4.2 | 97.3% | -5.4% |
| 33 | 78613 | Cedar Park | $481,661 | $213 | 62 | 3.6 | 97.5% | -1.9% |
| 34 | 78727 | Scofield, Milwood (North Austin) | $473,339 | $264 | 65 | 4.6 | 97.4% | -4.8% |
| 35 | 78721 | East Austin, MLK east | $468,089 | $322 | 80 | 8.8 | 96.6% | -8.3% |
| 36 | 78641 | Leander | $459,961 | $195 | 92 | 5.3 | 96.9% | -3.9% |
| 37 | 78729 | Milwood, Anderson Mill east | $455,717 | $226 | 54 | 4.3 | 97.6% | +0.5% |
| 38 | 78745 | South Austin, Westgate, Garrison Park | $451,991 | $303 | 68 | 5.6 | 97.0% | -5.7% |
| 39 | 78652 | Manchaca | $437,839 | $205 | 98 | 5.9 | 97.4% | -10.5% |
| 40 | 78633 | Georgetown north, Sun City | $434,477 | $207 | 89 | 4.2 | 98.0% | -0.8% |
| 41 | 78645 | Lago Vista, Jonestown | $427,783 | $216 | 110 | 8.4 | 96.9% | -4.1% |
| 42 | 78728 | Wells Branch | $417,470 | $224 | 67 | 3.2 | 97.7% | -3.5% |
| 43 | 78748 | South Austin, Slaughter Lane | $414,104 | $236 | 63 | 3.9 | 97.9% | -6.5% |
| 44 | 78744 | Southeast Austin, Easton Park | $399,722 | $212 | 101 | 4.7 | 97.2% | +2.5% |
| 45 | 78665 | Round Rock east, Teravista | $387,126 | $182 | 79 | 4.4 | 97.4% | -3.8% |
| 46 | 78752 | North Central, St. Johns, Highland | $386,752 | $278 | 72 | 7.9 | 96.4% | -5.0% |
| 47 | 78660 | Pflugerville | $384,473 | $186 | 82 | 5.2 | 97.6% | -5.0% |
| 48 | 78758 | North Austin, Domain-adjacent | $381,226 | $252 | 79 | 5.1 | 97.1% | -9.4% |
| 49 | 78612 | Cedar Creek | $378,456 | $183 | 152 | 7.5 | 96.4% | -14.3% |
| 50 | 78602 | Bastrop | $374,322 | $190 | 114 | 6.7 | 97.5% | +1.5% |
| 51 | 78724 | East Austin, Decker, Colony Park | $367,073 | $200 | 74 | 6.8 | 97.4% | +5.8% |
| 52 | 78747 | Onion Creek, Goodnight Ranch | $366,491 | $192 | 107 | 5.9 | 98.2% | -9.7% |
| 53 | 78741 | Riverside, Montopolis | $366,229 | $260 | 89 | 9.6 | 95.9% | +2.1% |
| 54 | 78626 | Georgetown east | $361,336 | $188 | 88 | 6.4 | 97.6% | -5.2% |
| 55 | 78753 | North Austin, Walnut Creek | $356,262 | $229 | 74 | 6.3 | 96.9% | -0.5% |
| 56 | 78754 | Northeast Austin, Harris Branch | $351,211 | $184 | 69 | 6.1 | 97.3% | -6.0% |
| 57 | 78653 | Manor | $344,146 | $173 | 91 | 6.2 | 97.7% | -4.3% |
| 58 | 78610 | Buda | $344,100 | $177 | 90 | 5.1 | 97.5% | -0.8% |
| 59 | 78664 | Round Rock central | $340,837 | $198 | 65 | 5.0 | 96.6% | -4.7% |
| 60 | 78634 | Hutto | $340,773 | $173 | 92 | 5.5 | 98.1% | -4.5% |
| 61 | 78666 | San Marcos | $322,728 | $181 | 102 | 6.6 | 96.9% | -7.6% |
| 62 | 78705 | West Campus, UT (condos) | $320,977 | $354 | 91 | 12.4 | 94.4% | -4.6% |
| 63 | 78957 | Smithville | $320,508 | $202 | 124 | 9.8 | 96.4% | -3.7% |
| 64 | 78617 | Del Valle | $320,076 | $172 | 86 | 5.0 | 97.6% | -2.6% |
| 65 | 78640 | Kyle | $306,300 | $164 | 94 | 5.1 | 97.8% | -6.2% |
| 66 | 76574 | Taylor | $292,492 | $167 | 80 | 7.2 | 96.7% | -5.2% |
| 67 | 78621 | Elgin | $286,563 | $165 | 105 | 6.4 | 98.3% | -5.8% |
| 68 | 78644 | Lockhart | $283,350 | $162 | 76 | 6.3 | 96.2% | -0.9% |
| 69 | 78725 | Hornsby Bend | $274,592 | $178 | 61 | 5.0 | 97.9% | -7.0% |
| 70 | 76537 | Jarrell | $260,120 | $151 | 106 | 5.8 | 97.9% | -4.5% |
| 71 | 78656 | Maxwell | $244,952 | $150 | 83 | 7.3 | 97.4% | -5.8% |
| 72 | 78648 | Luling | $207,425 | $155 | 136 | 12.0 | 94.4% | -16.4% |
Methodology and data notes
All figures are trailing twelve months, October 1, 2025 through September 30, 2026, pulled October 16, 2026 through Agent Intel. The 72-ZIP tables use Agent Intel's housing dataset for the Austin metro, all residential segments (single-family, condo, townhouse), ranked at the ZIP level; 14 metro ZIPs with too few closings to report a segment (PO-box ZIPs and rural ZIPs such as 78799, 78762, 78742, 78715, 78953, 78662, 78615, 76527, 76530, 76578, 78659, 78650, 78616, 78720) were excluded. The City of Austin benchmark and the deep-dive tables for 78746, 78703, 78738, 78704 and 78702 use Unlock MLS data via MLS Grid, residential property type, through Agent Intel. Months of inventory follows the Echelon Market Balance scale, where 6.0 months is balanced. One-year change compares the trailing-twelve-month median to the prior twelve months. Neighborhood labels are the dominant subdivisions in each ZIP, not exhaustive. Echelon Property Group refreshes this table quarterly; the next update follows the December 31, 2026 close.
The median of the 72 ZIP medians is $457,839, well under the city's $569,995 median, because the metro's ring of commuter towns outnumbers its core. The citywide benchmark for comparison, from Unlock MLS via Agent Intel for the same twelve months: $569,995 median, $295 per square foot, 43 median days on market, 4.93 months of inventory, 61.1 percent success rate, closed prices 3.05 percent under final asking and 3.92 percent under original asking, 10,784 closed sales, 2,496 expired and 4,531 withdrawn listings.
Price per square foot by ZIP: the league table
Price per square foot ranks the ZIPs differently than median price does, and it is the number that actually tells you what land and location cost. Downtown 78701 leads at $676 per square foot on a $636,082 median because the typical sale is a 940 square foot condo. Westlake 78746 is third per square foot but first by price because the typical sale is a 3,300 square foot house. The city median is $295 per square foot; the multiple column shows how far each ZIP sits from it.
The 25 most expensive Austin ZIPs per square foot
1
- ZIP
- 78701
- Area
- Downtown (condos)
- Median $/SF
- $676
- Multiple of city median ($295)
- 2.29x
- Median sale price
- $636,082
2
- ZIP
- 78703
- Area
- Tarrytown, Pemberton Heights, Clarksville
- Median $/SF
- $602
- Multiple of city median ($295)
- 2.04x
- Median sale price
- $1,274,281
3
- ZIP
- 78746
- Area
- Westlake Hills, Rollingwood, Lost Creek
- Median $/SF
- $560
- Multiple of city median ($295)
- 1.90x
- Median sale price
- $1,869,828
4
- ZIP
- 78704
- Area
- Zilker, Bouldin, Travis Heights, South Congress
- Median $/SF
- $492
- Multiple of city median ($295)
- 1.67x
- Median sale price
- $822,692
5
- ZIP
- 78756
- Area
- Rosedale, Allandale south
- Median $/SF
- $468
- Multiple of city median ($295)
- 1.59x
- Median sale price
- $724,952
6
- ZIP
- 78702
- Area
- East Austin, Holly, Govalle
- Median $/SF
- $457
- Multiple of city median ($295)
- 1.55x
- Median sale price
- $681,202
7
- ZIP
- 78751
- Area
- Hyde Park, North Loop
- Median $/SF
- $455
- Multiple of city median ($295)
- 1.54x
- Median sale price
- $643,080
8
- ZIP
- 78722
- Area
- Cherrywood, French Place
- Median $/SF
- $436
- Multiple of city median ($295)
- 1.48x
- Median sale price
- $583,567
9
- ZIP
- 78757
- Area
- Crestview, Allandale, Brentwood
- Median $/SF
- $432
- Multiple of city median ($295)
- 1.46x
- Median sale price
- $713,326
10
- ZIP
- 78733
- Area
- Davenport Ranch, Cuernavaca, Austin Lake Hills
- Median $/SF
- $421
- Multiple of city median ($295)
- 1.43x
- Median sale price
- $1,289,268
11
- ZIP
- 78731
- Area
- Northwest Hills, Cat Mountain
- Median $/SF
- $403
- Multiple of city median ($295)
- 1.37x
- Median sale price
- $1,084,668
12
- ZIP
- 78735
- Area
- Barton Creek, Travis Country
- Median $/SF
- $366
- Multiple of city median ($295)
- 1.24x
- Median sale price
- $824,439
13
- ZIP
- 78723
- Area
- Mueller, Windsor Park
- Median $/SF
- $355
- Multiple of city median ($295)
- 1.20x
- Median sale price
- $558,510
14
- ZIP
- 78705
- Area
- West Campus, UT (condos)
- Median $/SF
- $354
- Multiple of city median ($295)
- 1.20x
- Median sale price
- $320,977
15
- ZIP
- 78730
- Area
- River Place, Glenlake, Long Canyon
- Median $/SF
- $345
- Multiple of city median ($295)
- 1.17x
- Median sale price
- $1,170,036
16
- ZIP
- 78759
- Area
- Great Hills, Arboretum
- Median $/SF
- $327
- Multiple of city median ($295)
- 1.11x
- Median sale price
- $655,961
17
- ZIP
- 78721
- Area
- East Austin, MLK east
- Median $/SF
- $322
- Multiple of city median ($295)
- 1.09x
- Median sale price
- $468,089
18
- ZIP
- 78619
- Area
- Driftwood
- Median $/SF
- $313
- Multiple of city median ($295)
- 1.06x
- Median sale price
- $1,009,056
19
- ZIP
- 78745
- Area
- South Austin, Westgate, Garrison Park
- Median $/SF
- $303
- Multiple of city median ($295)
- 1.03x
- Median sale price
- $451,991
20
- ZIP
- 78739
- Area
- Circle C Ranch, Shady Hollow
- Median $/SF
- $295
- Multiple of city median ($295)
- 1.00x
- Median sale price
- $807,940
21
- ZIP
- 78749
- Area
- Legend Oaks, Western Oaks, Oak Hill east
- Median $/SF
- $290
- Multiple of city median ($295)
- 0.98x
- Median sale price
- $573,833
22
- ZIP
- 78738
- Area
- Bee Cave, Spanish Oaks, Lakeway south
- Median $/SF
- $280
- Multiple of city median ($295)
- 0.95x
- Median sale price
- $884,524
23
- ZIP
- 78750
- Area
- Anderson Mill, Jollyville
- Median $/SF
- $279
- Multiple of city median ($295)
- 0.95x
- Median sale price
- $605,486
24
- ZIP
- 78736
- Area
- West Oak Hill, Bee Creek
- Median $/SF
- $278
- Multiple of city median ($295)
- 0.94x
- Median sale price
- $517,449
25
- ZIP
- 78752
- Area
- North Central, St. Johns, Highland
- Median $/SF
- $278
- Multiple of city median ($295)
- 0.94x
- Median sale price
- $386,752
The 10 cheapest Austin-area ZIPs per square foot
63
- ZIP
- 78653
- Area
- Manor
- Median $/SF
- $173
- Multiple of city median ($295)
- 0.59x
- Median sale price
- $344,146
64
- ZIP
- 78634
- Area
- Hutto
- Median $/SF
- $173
- Multiple of city median ($295)
- 0.59x
- Median sale price
- $340,773
65
- ZIP
- 78617
- Area
- Del Valle
- Median $/SF
- $172
- Multiple of city median ($295)
- 0.58x
- Median sale price
- $320,076
66
- ZIP
- 76574
- Area
- Taylor
- Median $/SF
- $167
- Multiple of city median ($295)
- 0.57x
- Median sale price
- $292,492
67
- ZIP
- 78621
- Area
- Elgin
- Median $/SF
- $165
- Multiple of city median ($295)
- 0.56x
- Median sale price
- $286,563
68
- ZIP
- 78640
- Area
- Kyle
- Median $/SF
- $164
- Multiple of city median ($295)
- 0.56x
- Median sale price
- $306,300
69
- ZIP
- 78644
- Area
- Lockhart
- Median $/SF
- $162
- Multiple of city median ($295)
- 0.55x
- Median sale price
- $283,350
70
- ZIP
- 78648
- Area
- Luling
- Median $/SF
- $155
- Multiple of city median ($295)
- 0.53x
- Median sale price
- $207,425
71
- ZIP
- 76537
- Area
- Jarrell
- Median $/SF
- $151
- Multiple of city median ($295)
- 0.51x
- Median sale price
- $260,120
72
- ZIP
- 78656
- Area
- Maxwell
- Median $/SF
- $150
- Multiple of city median ($295)
- 0.51x
- Median sale price
- $244,952
Three things jump out of this table that the median-price table hides.
- 01The central core is a per-foot market, not a price market. Eight of the top nine per square foot (78701, 78703, 78704, 78756, 78702, 78751, 78722, 78757) are inside the urban core, where lots are small and the house is often the smaller part of the value. The exception is 78746, which is the only ZIP in the metro that is top three on both lists.
- 02The Lake Travis corridor is cheap per foot and expensive per house. 78738 (Bee Cave, Spanish Oaks) carries an $884,524 median on $280 per square foot, below the city average. 78732 (Steiner Ranch) is $807,435 on $266. You are buying square footage and views, not dirt.
- 03The ratio between 78703 and 78746 flipped the way it always does. Tarrytown out-prices Westlake per foot ($602 vs $560) because the Tarrytown median sale is roughly 2,100 square feet and the Westlake median sale is roughly 3,300. Same money, different houses. We covered the mechanics in Tarrytown vs Westlake and The Eanes Premium.
West Austin and the luxury core
The six seven-figure ZIPs form a single arc west of MoPac, from Tarrytown through Westlake and up the Lake Austin corridor to River Place, plus Driftwood out in Hays County. Together with the Lake Travis ZIPs they account for most of the metro's $2 million-plus trade, and they behave nothing alike.
78746
- Area
- Westlake Hills, Rollingwood, Lost Creek
- Median sale price
- $1,869,828
- Median $/SF
- $560
- Median DOM
- 87
- Months of inventory
- 5.3
- Sale-to-list
- 95.1%
- 1-yr change
- +10.0%
78733
- Area
- Davenport Ranch, Cuernavaca, Austin Lake Hills
- Median sale price
- $1,289,268
- Median $/SF
- $421
- Median DOM
- 50
- Months of inventory
- 5.0
- Sale-to-list
- 95.8%
- 1-yr change
- +4.1%
78703
- Area
- Tarrytown, Pemberton Heights, Clarksville
- Median sale price
- $1,274,281
- Median $/SF
- $602
- Median DOM
- 69
- Months of inventory
- 6.9
- Sale-to-list
- 95.0%
- 1-yr change
- -7.7%
78730
- Area
- River Place, Glenlake, Long Canyon
- Median sale price
- $1,170,036
- Median $/SF
- $345
- Median DOM
- 64
- Months of inventory
- 5.0
- Sale-to-list
- 96.5%
- 1-yr change
- -5.3%
78731
- Area
- Northwest Hills, Cat Mountain
- Median sale price
- $1,084,668
- Median $/SF
- $403
- Median DOM
- 69
- Months of inventory
- 4.1
- Sale-to-list
- 96.0%
- 1-yr change
- -2.9%
78619
- Area
- Driftwood
- Median sale price
- $1,009,056
- Median $/SF
- $313
- Median DOM
- 93
- Months of inventory
- 8.9
- Sale-to-list
- 96.9%
- 1-yr change
- -5.9%
78738
- Area
- Bee Cave, Spanish Oaks, Lakeway south
- Median sale price
- $884,524
- Median $/SF
- $280
- Median DOM
- 70
- Months of inventory
- 4.4
- Sale-to-list
- 96.9%
- 1-yr change
- +6.8%
78735
- Area
- Barton Creek, Travis Country
- Median sale price
- $824,439
- Median $/SF
- $366
- Median DOM
- 67
- Months of inventory
- 4.2
- Sale-to-list
- 96.3%
- 1-yr change
- -7.1%
78732
- Area
- Steiner Ranch
- Median sale price
- $807,435
- Median $/SF
- $266
- Median DOM
- 90
- Months of inventory
- 5.7
- Sale-to-list
- 96.5%
- 1-yr change
- -6.5%
78734
- Area
- Lakeway, Hudson Bend
- Median sale price
- $651,452
- Median $/SF
- $275
- Median DOM
- 87
- Months of inventory
- 7.8
- Sale-to-list
- 96.2%
- 1-yr change
- -5.2%
78669
- Area
- Spicewood
- Median sale price
- $637,454
- Median $/SF
- $262
- Median DOM
- 125
- Months of inventory
- 10.9
- Sale-to-list
- 95.7%
- 1-yr change
- -5.0%
78620
- Area
- Dripping Springs
- Median sale price
- $610,875
- Median $/SF
- $244
- Median DOM
- 89
- Months of inventory
- 5.7
- Sale-to-list
- 97.0%
- 1-yr change
- -1.6%
What the Unlock MLS listing data adds for the three biggest luxury ZIPs
The table above tells you what sold. Unlock MLS listing data (via Agent Intel, same twelve months) tells you what did not, which matters more if you are the seller.
Closed sales
- 78746 Westlake
- 319
- 78703 Tarrytown
- 228
- 78738 Bee Cave and Lakeway
- 705
Dollar volume
- 78746 Westlake
- $750 million
- 78703 Tarrytown
- $370 million
- 78738 Bee Cave and Lakeway
- $805 million
Median sale price
- 78746 Westlake
- $1,850,000
- 78703 Tarrytown
- $1,302,500
- 78738 Bee Cave and Lakeway
- $880,000
Average sale price
- 78746 Westlake
- $2,349,823
- 78703 Tarrytown
- $1,624,333
- 78738 Bee Cave and Lakeway
- $1,141,846
Average vs median
- 78746 Westlake
- +27%
- 78703 Tarrytown
- +25%
- 78738 Bee Cave and Lakeway
- +30%
Median $/SF (average $/SF)
- 78746 Westlake
- $565 ($619)
- 78703 Tarrytown
- $613 ($643)
- 78738 Bee Cave and Lakeway
- $283 ($317)
Median days on market (average)
- 78746 Westlake
- 48.5 (90.2)
- 78703 Tarrytown
- 55.5 (87.6)
- 78738 Bee Cave and Lakeway
- 44 (81.2)
Listing success rate
- 78746 Westlake
- 56.9%
- 78703 Tarrytown
- 48.2%
- 78738 Bee Cave and Lakeway
- 67.4%
Expired plus withdrawn listings
- 78746 Westlake
- 248
- 78703 Tarrytown
- 242
- 78738 Bee Cave and Lakeway
- 342
Listings with a price reduction
- 78746 Westlake
- 245
- 78703 Tarrytown
- 223
- 78738 Bee Cave and Lakeway
- 562
Original list to final list
- 78746 Westlake
- -3.77%
- 78703 Tarrytown
- -4.42%
- 78738 Bee Cave and Lakeway
- -3.39%
Final list to closed price
- 78746 Westlake
- -4.88%
- 78703 Tarrytown
- -4.97%
- 78738 Bee Cave and Lakeway
- -3.06%
Combined discount from original ask
- 78746 Westlake
- about 8.5%
- 78703 Tarrytown
- about 9.2%
- 78738 Bee Cave and Lakeway
- about 6.3%
Months of inventory
- 78746 Westlake
- 5.2
- 78703 Tarrytown
- 6.2
- 78738 Bee Cave and Lakeway
- 4.0
One-year change in median
- 78746 Westlake
- +5.7%
- 78703 Tarrytown
- -6.2%
- 78738 Bee Cave and Lakeway
- +3.6%
Read the success-rate row twice. In Tarrytown, fewer than half the listings that hit Unlock MLS in the past year closed; 242 expired or were withdrawn against 228 sales. Westlake closed 57 percent. Bee Cave and Lakeway closed 67 percent, on four months of inventory, with the metro's biggest luxury dollar volume at $805 million. If you are listing above $2 million in 78703 or 78746, the base rate says you have roughly a coin flip of closing on the first listing agreement, and the ones that do close give up 8 to 9 percent from the original ask. That is the math behind why luxury homes don't sell in Austin and why Echelon Property Group runs most $2 million-plus transactions off-market.
The two datasets disagree on direction for 78703 (-7.7 percent vs -6.2 percent) and 78746 (+10.0 percent vs +5.7 percent) because they slice the sales differently, but both agree on the shape: Westlake is the one West Austin ZIP whose median rose this year, Tarrytown gave back the most, and the Lake Travis side (78738) rose on volume while the Lake Austin side (78732, 78734) fell. For the corridor-by-corridor case, see Lake Austin vs Lake Travis, Bee Cave vs Lakeway, Living in Barton Creek and the 78746 luxury homes guide.
Central and East Austin
The urban core is the most expensive part of the metro per square foot and the slowest to clear. Ten of the thirteen central ZIPs lost ground this year, the two downtown condo ZIPs carry a full year of inventory, and in 78704 more listings died than closed.
78704
- Area
- Zilker, Bouldin, Travis Heights, South Congress
- Median sale price
- $822,692
- Median $/SF
- $492
- Median DOM
- 90
- Months of inventory
- 7.0
- Sale-to-list
- 96.1%
- 1-yr change
- -7.2%
78756
- Area
- Rosedale, Allandale south
- Median sale price
- $724,952
- Median $/SF
- $468
- Median DOM
- 64
- Months of inventory
- 4.5
- Sale-to-list
- 96.9%
- 1-yr change
- -11.8%
78757
- Area
- Crestview, Allandale, Brentwood
- Median sale price
- $713,326
- Median $/SF
- $432
- Median DOM
- 62
- Months of inventory
- 5.0
- Sale-to-list
- 96.7%
- 1-yr change
- +6.9%
78702
- Area
- East Austin, Holly, Govalle
- Median sale price
- $681,202
- Median $/SF
- $457
- Median DOM
- 71
- Months of inventory
- 8.2
- Sale-to-list
- 96.5%
- 1-yr change
- -2.1%
78751
- Area
- Hyde Park, North Loop
- Median sale price
- $643,080
- Median $/SF
- $455
- Median DOM
- 90
- Months of inventory
- 6.6
- Sale-to-list
- 96.7%
- 1-yr change
- -3.1%
78701
- Area
- Downtown (condos)
- Median sale price
- $636,082
- Median $/SF
- $676
- Median DOM
- 102
- Months of inventory
- 12.2
- Sale-to-list
- 95.2%
- 1-yr change
- -5.5%
78722
- Area
- Cherrywood, French Place
- Median sale price
- $583,567
- Median $/SF
- $436
- Median DOM
- 94
- Months of inventory
- 5.3
- Sale-to-list
- 95.1%
- 1-yr change
- -7.8%
78723
- Area
- Mueller, Windsor Park
- Median sale price
- $558,510
- Median $/SF
- $355
- Median DOM
- 74
- Months of inventory
- 5.6
- Sale-to-list
- 97.3%
- 1-yr change
- -4.2%
78721
- Area
- East Austin, MLK east
- Median sale price
- $468,089
- Median $/SF
- $322
- Median DOM
- 80
- Months of inventory
- 8.8
- Sale-to-list
- 96.6%
- 1-yr change
- -8.3%
78752
- Area
- North Central, St. Johns, Highland
- Median sale price
- $386,752
- Median $/SF
- $278
- Median DOM
- 72
- Months of inventory
- 7.9
- Sale-to-list
- 96.4%
- 1-yr change
- -5.0%
78724
- Area
- East Austin, Decker, Colony Park
- Median sale price
- $367,073
- Median $/SF
- $200
- Median DOM
- 74
- Months of inventory
- 6.8
- Sale-to-list
- 97.4%
- 1-yr change
- +5.8%
78741
- Area
- Riverside, Montopolis
- Median sale price
- $366,229
- Median $/SF
- $260
- Median DOM
- 89
- Months of inventory
- 9.6
- Sale-to-list
- 95.9%
- 1-yr change
- +2.1%
78705
- Area
- West Campus, UT (condos)
- Median sale price
- $320,977
- Median $/SF
- $354
- Median DOM
- 91
- Months of inventory
- 12.4
- Sale-to-list
- 94.4%
- 1-yr change
- -4.6%
78704 and 78702 under the Unlock MLS microscope
Closed sales
- 78704 South Central
- 584
- 78702 East Austin
- 343
Dollar volume
- 78704 South Central
- $616 million
- 78702 East Austin
- $246 million
Median sale price
- 78704 South Central
- $845,400
- 78702 East Austin
- $662,500
Average sale price
- 78704 South Central
- $1,054,978
- 78702 East Austin
- $715,829
Median $/SF (average $/SF)
- 78704 South Central
- $512 ($542)
- 78702 East Austin
- $467 ($477)
Median days on market (average)
- 78704 South Central
- 61 (96.1)
- 78702 East Austin
- 49 (93.7)
Listing success rate
- 78704 South Central
- 49.8%
- 78702 East Austin
- 47.7%
Expired plus withdrawn listings
- 78704 South Central
- 611
- 78702 East Austin
- 393
Listings with a price reduction
- 78704 South Central
- 666
- 78702 East Austin
- 434
Original list to final list
- 78704 South Central
- -5.05%
- 78702 East Austin
- -5.24%
Final list to closed price
- 78704 South Central
- -3.88%
- 78702 East Austin
- -3.50%
Combined discount from original ask
- 78704 South Central
- about 8.7%
- 78702 East Austin
- about 8.6%
Months of inventory
- 78704 South Central
- 6.7
- 78702 East Austin
- 7.8
One-year change in median
- 78704 South Central
- -6.1%
- 78702 East Austin
- -3.3%
The 78704 number worth memorizing: 611 listings expired or were withdrawn against 584 closed sales. For every house that sold in Zilker, Bouldin and Travis Heights this year, slightly more than one came off the market unsold. In 78702 the ratio is 393 to 343. Both ZIPs close around 8.6 percent under the original ask. The buyer-side read is simple: in the central core, the first list price is a suggestion, the second one is the negotiation, and the third one is where you buy.
The two condo ZIPs are their own market. 78701 at 12.2 months of inventory and 78705 at 12.4 are the deepest buyer's markets in the metro, both selling at roughly 95 percent of asking after 100-plus days. 78701's $676 per square foot is the highest in the city and still down 5.5 percent year over year, with no new for-sale tower delivering before about 2029. The full case is in Downtown Austin condos 2026.
Two central ZIPs went the other way. 78757 (Crestview, Allandale, Brentwood) rose 6.9 percent on 62 days and 5.0 months of inventory, and 78724 (Decker, Colony Park) rose 5.8 percent on the cheapest per-foot price inside the city at $200. The 78756 decline of 11.8 percent next door to 78757's gain is almost certainly mix: Rosedale and Shoalwood trade a handful of new-construction sales against original 1940s bungalows, and the median swings on which kind sold. Treat any central ZIP with fewer than 200 annual sales as a mix-sensitive number, not a trend.
North, Northwest, South and Southwest Austin
The belt of 1980s-to-2000s subdivisions inside the city limits is where the Austin market still functions like a market: inventory under four months, contracts in two months, closed prices within two points of asking. Circle C (78739) is the tightest ZIP in the metro, and the whole southwest quadrant from Legend Oaks to Belterra is either flat or up.
North and Northwest Austin
78726
- Area
- Four Points, Canyon Creek
- Median sale price
- $689,152
- Median $/SF
- $248
- Median DOM
- 66
- Months of inventory
- 4.5
- Sale-to-list
- 97.2%
- 1-yr change
- -1.6%
78759
- Area
- Great Hills, Arboretum
- Median sale price
- $655,961
- Median $/SF
- $327
- Median DOM
- 58
- Months of inventory
- 3.7
- Sale-to-list
- 97.2%
- 1-yr change
- +2.1%
78717
- Area
- Avery Ranch, Brushy Creek
- Median sale price
- $608,069
- Median $/SF
- $231
- Median DOM
- 66
- Months of inventory
- 4.4
- Sale-to-list
- 97.5%
- 1-yr change
- +7.1%
78750
- Area
- Anderson Mill, Jollyville
- Median sale price
- $605,486
- Median $/SF
- $279
- Median DOM
- 61
- Months of inventory
- 3.5
- Sale-to-list
- 97.2%
- 1-yr change
- +0.6%
78727
- Area
- Scofield, Milwood (North Austin)
- Median sale price
- $473,339
- Median $/SF
- $264
- Median DOM
- 65
- Months of inventory
- 4.6
- Sale-to-list
- 97.4%
- 1-yr change
- -4.8%
78729
- Area
- Milwood, Anderson Mill east
- Median sale price
- $455,717
- Median $/SF
- $226
- Median DOM
- 54
- Months of inventory
- 4.3
- Sale-to-list
- 97.6%
- 1-yr change
- +0.5%
78728
- Area
- Wells Branch
- Median sale price
- $417,470
- Median $/SF
- $224
- Median DOM
- 67
- Months of inventory
- 3.2
- Sale-to-list
- 97.7%
- 1-yr change
- -3.5%
78758
- Area
- North Austin, Domain-adjacent
- Median sale price
- $381,226
- Median $/SF
- $252
- Median DOM
- 79
- Months of inventory
- 5.1
- Sale-to-list
- 97.1%
- 1-yr change
- -9.4%
78753
- Area
- North Austin, Walnut Creek
- Median sale price
- $356,262
- Median $/SF
- $229
- Median DOM
- 74
- Months of inventory
- 6.3
- Sale-to-list
- 96.9%
- 1-yr change
- -0.5%
78754
- Area
- Northeast Austin, Harris Branch
- Median sale price
- $351,211
- Median $/SF
- $184
- Median DOM
- 69
- Months of inventory
- 6.1
- Sale-to-list
- 97.3%
- 1-yr change
- -6.0%
South and Southwest Austin
78737
- Area
- Belterra, Highpointe (SW Austin)
- Median sale price
- $844,314
- Median $/SF
- $273
- Median DOM
- 75
- Months of inventory
- 3.8
- Sale-to-list
- 97.5%
- 1-yr change
- +5.0%
78739
- Area
- Circle C Ranch, Shady Hollow
- Median sale price
- $807,940
- Median $/SF
- $295
- Median DOM
- 45
- Months of inventory
- 2.4
- Sale-to-list
- 98.6%
- 1-yr change
- +5.3%
78749
- Area
- Legend Oaks, Western Oaks, Oak Hill east
- Median sale price
- $573,833
- Median $/SF
- $290
- Median DOM
- 49
- Months of inventory
- 3.0
- Sale-to-list
- 98.5%
- 1-yr change
- +0.1%
78736
- Area
- West Oak Hill, Bee Creek
- Median sale price
- $517,449
- Median $/SF
- $278
- Median DOM
- 63
- Months of inventory
- 4.3
- Sale-to-list
- 97.0%
- 1-yr change
- -9.6%
78745
- Area
- South Austin, Westgate, Garrison Park
- Median sale price
- $451,991
- Median $/SF
- $303
- Median DOM
- 68
- Months of inventory
- 5.6
- Sale-to-list
- 97.0%
- 1-yr change
- -5.7%
78652
- Area
- Manchaca
- Median sale price
- $437,839
- Median $/SF
- $205
- Median DOM
- 98
- Months of inventory
- 5.9
- Sale-to-list
- 97.4%
- 1-yr change
- -10.5%
78748
- Area
- South Austin, Slaughter Lane
- Median sale price
- $414,104
- Median $/SF
- $236
- Median DOM
- 63
- Months of inventory
- 3.9
- Sale-to-list
- 97.9%
- 1-yr change
- -6.5%
78744
- Area
- Southeast Austin, Easton Park
- Median sale price
- $399,722
- Median $/SF
- $212
- Median DOM
- 101
- Months of inventory
- 4.7
- Sale-to-list
- 97.2%
- 1-yr change
- +2.5%
78747
- Area
- Onion Creek, Goodnight Ranch
- Median sale price
- $366,491
- Median $/SF
- $192
- Median DOM
- 107
- Months of inventory
- 5.9
- Sale-to-list
- 98.2%
- 1-yr change
- -9.7%
The pattern across both tables is the same one that showed up in Austin inventory levels explained: months of inventory predicts price direction better than price level does. Every ZIP in these two tables under 4.0 months of inventory (78739, 78749, 78728, 78750, 78759, 78737, 78748) sold at 97.2 percent of asking or better, and six of the seven held or gained. Every ZIP over 5.5 months (78753, 78754, 78745, 78652, 78747) lost ground.
The outliers are worth naming. 78717 (Avery Ranch) at +7.1 percent is the best-performing ZIP north of the river with meaningful volume. 78758 at -9.4 percent is the worst inside the city, which is what a flood of Domain-area condo and townhome deliveries does to a median. 78747 and 78744 are the two cheapest ZIPs south of the river, both under $400,000, and they tell opposite stories: Easton Park (78744) rose 2.5 percent on new-build demand while Onion Creek and Goodnight Ranch (78747) fell 9.7 percent on 107 days of market time. The spread between them is $33,000; the spread in direction is 12 points.
Commuter suburbs: Williamson, Hays, Bastrop and the lake towns
The suburbs are where the metro's price declines concentrate, and they are also where closed prices sit closest to asking, because new-construction builders set the list price and then buy it down with incentives instead of cutting it. Cedar Park and west Round Rock are the only commuter ZIPs that still clear in about two months.
Williamson County
78642
- Area
- Liberty Hill
- Median sale price
- $507,682
- Median $/SF
- $195
- Median DOM
- 121
- Months of inventory
- 5.8
- Sale-to-list
- 97.3%
- 1-yr change
- +2.3%
78628
- Area
- Georgetown west, Wolf Ranch
- Median sale price
- $502,573
- Median $/SF
- $204
- Median DOM
- 106
- Months of inventory
- 5.3
- Sale-to-list
- 97.3%
- 1-yr change
- -0.7%
78681
- Area
- Round Rock west, Brushy Creek
- Median sale price
- $486,929
- Median $/SF
- $214
- Median DOM
- 65
- Months of inventory
- 4.2
- Sale-to-list
- 97.3%
- 1-yr change
- -5.4%
78613
- Area
- Cedar Park
- Median sale price
- $481,661
- Median $/SF
- $213
- Median DOM
- 62
- Months of inventory
- 3.6
- Sale-to-list
- 97.5%
- 1-yr change
- -1.9%
78641
- Area
- Leander
- Median sale price
- $459,961
- Median $/SF
- $195
- Median DOM
- 92
- Months of inventory
- 5.3
- Sale-to-list
- 96.9%
- 1-yr change
- -3.9%
78633
- Area
- Georgetown north, Sun City
- Median sale price
- $434,477
- Median $/SF
- $207
- Median DOM
- 89
- Months of inventory
- 4.2
- Sale-to-list
- 98.0%
- 1-yr change
- -0.8%
78665
- Area
- Round Rock east, Teravista
- Median sale price
- $387,126
- Median $/SF
- $182
- Median DOM
- 79
- Months of inventory
- 4.4
- Sale-to-list
- 97.4%
- 1-yr change
- -3.8%
78660
- Area
- Pflugerville
- Median sale price
- $384,473
- Median $/SF
- $186
- Median DOM
- 82
- Months of inventory
- 5.2
- Sale-to-list
- 97.6%
- 1-yr change
- -5.0%
78626
- Area
- Georgetown east
- Median sale price
- $361,336
- Median $/SF
- $188
- Median DOM
- 88
- Months of inventory
- 6.4
- Sale-to-list
- 97.6%
- 1-yr change
- -5.2%
78664
- Area
- Round Rock central
- Median sale price
- $340,837
- Median $/SF
- $198
- Median DOM
- 65
- Months of inventory
- 5.0
- Sale-to-list
- 96.6%
- 1-yr change
- -4.7%
78634
- Area
- Hutto
- Median sale price
- $340,773
- Median $/SF
- $173
- Median DOM
- 92
- Months of inventory
- 5.5
- Sale-to-list
- 98.1%
- 1-yr change
- -4.5%
76574
- Area
- Taylor
- Median sale price
- $292,492
- Median $/SF
- $167
- Median DOM
- 80
- Months of inventory
- 7.2
- Sale-to-list
- 96.7%
- 1-yr change
- -5.2%
76537
- Area
- Jarrell
- Median sale price
- $260,120
- Median $/SF
- $151
- Median DOM
- 106
- Months of inventory
- 5.8
- Sale-to-list
- 97.9%
- 1-yr change
- -4.5%
Hays County and the Hill Country
78619
- Area
- Driftwood
- Median sale price
- $1,009,056
- Median $/SF
- $313
- Median DOM
- 93
- Months of inventory
- 8.9
- Sale-to-list
- 96.9%
- 1-yr change
- -5.9%
78620
- Area
- Dripping Springs
- Median sale price
- $610,875
- Median $/SF
- $244
- Median DOM
- 89
- Months of inventory
- 5.7
- Sale-to-list
- 97.0%
- 1-yr change
- -1.6%
78676
- Area
- Wimberley
- Median sale price
- $547,764
- Median $/SF
- $272
- Median DOM
- 107
- Months of inventory
- 8.9
- Sale-to-list
- 95.9%
- 1-yr change
- +15.5%
78610
- Area
- Buda
- Median sale price
- $344,100
- Median $/SF
- $177
- Median DOM
- 90
- Months of inventory
- 5.1
- Sale-to-list
- 97.5%
- 1-yr change
- -0.8%
78666
- Area
- San Marcos
- Median sale price
- $322,728
- Median $/SF
- $181
- Median DOM
- 102
- Months of inventory
- 6.6
- Sale-to-list
- 96.9%
- 1-yr change
- -7.6%
78640
- Area
- Kyle
- Median sale price
- $306,300
- Median $/SF
- $164
- Median DOM
- 94
- Months of inventory
- 5.1
- Sale-to-list
- 97.8%
- 1-yr change
- -6.2%
78656
- Area
- Maxwell
- Median sale price
- $244,952
- Median $/SF
- $150
- Median DOM
- 83
- Months of inventory
- 7.3
- Sale-to-list
- 97.4%
- 1-yr change
- -5.8%
Lake Travis west, Bastrop and Caldwell counties
78669
- Area
- Spicewood
- Median sale price
- $637,454
- Median $/SF
- $262
- Median DOM
- 125
- Months of inventory
- 10.9
- Sale-to-list
- 95.7%
- 1-yr change
- -5.0%
78645
- Area
- Lago Vista, Jonestown
- Median sale price
- $427,783
- Median $/SF
- $216
- Median DOM
- 110
- Months of inventory
- 8.4
- Sale-to-list
- 96.9%
- 1-yr change
- -4.1%
78612
- Area
- Cedar Creek
- Median sale price
- $378,456
- Median $/SF
- $183
- Median DOM
- 152
- Months of inventory
- 7.5
- Sale-to-list
- 96.4%
- 1-yr change
- -14.3%
78602
- Area
- Bastrop
- Median sale price
- $374,322
- Median $/SF
- $190
- Median DOM
- 114
- Months of inventory
- 6.7
- Sale-to-list
- 97.5%
- 1-yr change
- +1.5%
78653
- Area
- Manor
- Median sale price
- $344,146
- Median $/SF
- $173
- Median DOM
- 91
- Months of inventory
- 6.2
- Sale-to-list
- 97.7%
- 1-yr change
- -4.3%
78957
- Area
- Smithville
- Median sale price
- $320,508
- Median $/SF
- $202
- Median DOM
- 124
- Months of inventory
- 9.8
- Sale-to-list
- 96.4%
- 1-yr change
- -3.7%
78617
- Area
- Del Valle
- Median sale price
- $320,076
- Median $/SF
- $172
- Median DOM
- 86
- Months of inventory
- 5.0
- Sale-to-list
- 97.6%
- 1-yr change
- -2.6%
78621
- Area
- Elgin
- Median sale price
- $286,563
- Median $/SF
- $165
- Median DOM
- 105
- Months of inventory
- 6.4
- Sale-to-list
- 98.3%
- 1-yr change
- -5.8%
78644
- Area
- Lockhart
- Median sale price
- $283,350
- Median $/SF
- $162
- Median DOM
- 76
- Months of inventory
- 6.3
- Sale-to-list
- 96.2%
- 1-yr change
- -0.9%
78725
- Area
- Hornsby Bend
- Median sale price
- $274,592
- Median $/SF
- $178
- Median DOM
- 61
- Months of inventory
- 5.0
- Sale-to-list
- 97.9%
- 1-yr change
- -7.0%
78648
- Area
- Luling
- Median sale price
- $207,425
- Median $/SF
- $155
- Median DOM
- 136
- Months of inventory
- 12.0
- Sale-to-list
- 94.4%
- 1-yr change
- -16.4%
Four reads from the suburban tables.
- 01Sale-to-list is lying to you out here. Hutto closes at 98.1 percent of asking and is down 4.5 percent. Elgin closes at 98.3 percent and is down 5.8 percent. Kyle, 97.8 percent and down 6.2 percent. Those are builder ZIPs, and builders hold the sticker and give the discount back as a rate buydown or closing credit, which never shows up in the sale-to-list ratio. The real concession math is in Austin builder incentives.
- 02The MUD and PID tax stack explains the $/SF gap. Hutto at $173 per square foot and Kyle at $164 are not half the price of Austin because the houses are worse. They carry total tax rates of $2.20 to $3.00 per $100 against roughly $1.80 to $2.05 inside Austin, and the market capitalizes that difference into the price. Worked numbers are in MUD and PID taxes in Austin.
- 03Taylor is the warning label on headline-driven buying. The Samsung fab did not stop 76574 from falling 5.2 percent on 7.2 months of inventory. Jobs announced are not households moved.
- 04The far ring is a buyer's market by any definition. Spicewood (10.9 months), Smithville (9.8), Driftwood (8.9), Wimberley (8.9), Lago Vista (8.4) and Luling (12.0) all sit well past the six-month balance point. Wimberley's +15.5 percent is the one gain in the group and should be read as a small-sample mix shift after the 2025 flood year, not a boom.
For the household-level version of this migration, see where Austin homeowners are moving and best Austin suburbs 2026.
How to read the numbers
A ZIP median is a mix-weighted average of whatever happened to sell, so the table is a map, not an appraisal. Six definitions keep you from misreading it.
Median sale price
- What it measures
- The middle closed price; half sold above, half below
- City of Austin benchmark (T12 to Sep 30, 2026)
- $569,995
- How to use it
- Compare ZIPs at a glance. Never use it to price a specific house
Median $/SF
- What it measures
- Closed price divided by living area, middle value
- City of Austin benchmark (T12 to Sep 30, 2026)
- $295
- How to use it
- The cleanest proxy for land and location value; compare like-sized houses only
Median days on market
- What it measures
- Days from list to contract for the middle listing
- City of Austin benchmark (T12 to Sep 30, 2026)
- 43 (average 79)
- How to use it
- The average is nearly double the median because stale luxury listings drag the tail
Months of inventory
- What it measures
- Active listings divided by the monthly sales pace
- City of Austin benchmark (T12 to Sep 30, 2026)
- 4.93
- How to use it
- Under 6 leans seller, over 6 leans buyer, 6 is balanced on the Echelon Market Balance scale
Sale-to-list
- What it measures
- Closed price as a share of final list price
- City of Austin benchmark (T12 to Sep 30, 2026)
- 96.95% (3.05% under)
- How to use it
- Add the original-to-final cut (3.92%) for the real discount: about 7% from first ask
Success rate
- What it measures
- Share of listings that closed instead of expiring or being withdrawn
- City of Austin benchmark (T12 to Sep 30, 2026)
- 61.1%
- How to use it
- The seller's base rate; 48 to 57 percent in the luxury core, 67 percent in Bee Cave and Lakeway
Median vs mix. When 78756 shows -11.8 percent and 78757 next door shows +6.9 percent, Rosedale did not lose a tenth of its value in a year. A ZIP with 150 sales swings on whether this year's closings skewed to new construction or to original bungalows. Treat any ZIP under 200 annual closings as directional and check the per-square-foot number before believing the median.
Price per square foot is a land index. In the urban core, where lots are 6,000 to 8,000 square feet and the house may be 1,200, $/SF mostly measures dirt. In Steiner Ranch or Belterra, where the house is 3,000 square feet on a quarter acre, it mostly measures the house. That is why 78702 at $457 can out-rank 78738 at $280 while the Bee Cave house costs $200,000 more.
The double discount. Sale-to-list only captures the last cut. Citywide, listings dropped 3.92 percent from original to final list and then closed 3.05 percent under that, for a combined 6.9 percent off the first ask. In 78703 and 78704 the combined figure is about 9 percent. If you are a buyer modeling an offer, start from the original list price, not the current one.
Success rate is the number listing agents don't put on the flyer. Of the 17,821 new City of Austin listings in the past twelve months, 2,496 expired and 4,531 were withdrawn against 10,784 closings. Roughly four in ten listings did not sell. In Tarrytown, East Austin and 78704 it was more than half. That base rate, not the median price, is what should drive how you price and where you market. We wrote the playbook in why didn't my house sell.
The non-disclosure caveat. Texas does not record sale prices in public records, so every ZIP figure that is not MLS-derived is an estimate built from listing prices, assessed values and modeled sales. The figures here come from closed MLS transactions through Agent Intel; a Zestimate for the same ZIP can miss by 6 to 7 percent on an off-market home, as Zillow's own accuracy tables show. Details in Texas is a non-disclosure state and Zestimate accuracy in Texas.
Two datasets, one direction. The 72-ZIP table uses Agent Intel's all-residential housing dataset; the deep-dive tables for 78746, 78703, 78738, 78704 and 78702 use Unlock MLS listing data via MLS Grid, which adds success rates and listing counts. The two sources differ by one to four percent on any given ZIP because they treat condos, new construction and relists differently. Where they disagree on magnitude, they agree on direction in every ZIP we checked.
What the data says for buyers and sellers, by price tier
Leverage in Austin right now is a function of inventory and failure rate, not price, and both rise with the price tag. Buyers have the most room above $1 million in the central core; sellers have the most room in the sub-$900,000 subdivisions west and southwest of downtown.
Under $500,000
- ZIPs where sellers still hold the cards (under 4.5 months, 97%+ of ask)
- 78728, 78748, 78749, 78613, 78633, 78681, 78665
- ZIPs where buyers hold the cards (over 6.5 months or under 96% of ask)
- 78741, 78752, 78753, 78754, 78666, 78612, 78648
- Realistic discount from original ask
- 3 to 5 percent, more at the far ring
$500,000 to $1,000,000
- ZIPs where sellers still hold the cards (under 4.5 months, 97%+ of ask)
- 78739, 78737, 78759, 78750, 78717, 78735, 78738
- ZIPs where buyers hold the cards (over 6.5 months or under 96% of ask)
- 78704, 78702, 78751, 78701, 78734, 78669, 78619
- Realistic discount from original ask
- 5 to 9 percent in the core, 3 to 4 in the suburbs
$1,000,000 to $2,000,000
- ZIPs where sellers still hold the cards (under 4.5 months, 97%+ of ask)
- 78731, 78733, 78730
- ZIPs where buyers hold the cards (over 6.5 months or under 96% of ask)
- 78703, 78704 (upper end), 78701
- Realistic discount from original ask
- 8 to 9 percent on the listings that close; 48 to 57 percent close
$2,000,000 and up
- ZIPs where sellers still hold the cards (under 4.5 months, 97%+ of ask)
- None by the numbers; well-priced 78746 and 78733 listings still trade
- ZIPs where buyers hold the cards (over 6.5 months or under 96% of ask)
- 78703, 78746 (long-tail listings), Lake Travis waterfront
- Realistic discount from original ask
- 9 percent-plus, or off-market at a negotiated number
For buyers
- Under $1 million, do not expect a discount in 78739, 78749 or 78759. Circle C is at 2.4 months of inventory and 98.6 percent of ask; a lowball there costs you the house. Offer at list, ask for the inspection credit instead.
- Between $1 million and $2 million in 78703, 78704 or 78702, work the double discount. Pull the original list price, model 8 to 9 percent off it, and let the 48 percent success rate do the negotiating. A seller 90 days in with a 1-in-2 shot of closing is reading the same table you are.
- Above $2 million, the MLS is the catalog of what nobody wanted at the first price. Every $2 million-plus sale Echelon Property Group has closed came from off-market inventory, where the price is set once by two parties instead of cut three times in public.
- In the builder suburbs (Hutto, Kyle, Elgin, Leander), ignore sale-to-list and negotiate the incentive package. A 97.8 percent ratio with a $30,000 buydown attached is a 92 percent sale.
For sellers
- Price to the success rate, not the median. In 78746 a listing that opens 5 percent above the comps joins the 43 percent that expire; one that opens at the comps joins the 57 percent that close and gives up about 5 percent at the table. The second path nets more and takes 48 days instead of 150. The pricing math is in how to price a luxury home in Austin.
- In the sub-$900,000 southwest belt, you have the only genuine seller's market in the metro. List in the first half of the week, hold your number for 14 days, and expect to close within two points of it.
- In the central core above $1 million, decide before you list whether you can absorb a 9 percent combined discount and a coin-flip close rate. If not, a private listing protects the number and the days-on-market clock.
- Timing still matters more than most sellers think. The ZIP table is twelve months blended; the monthly version shows a July second peak and an October dead zone in the luxury core. See the best time to sell a house in Austin and should I sell now or wait.
Frequently Asked Questions
What is the median home price in Austin, Texas in 2026?
The median home sale price in the City of Austin is $569,995 for the twelve months ending September 30, 2026, at a median $295 per square foot, down 0.87 percent from the prior year (Unlock MLS via Agent Intel).
What is the most expensive ZIP code in Austin?
78746 (Westlake Hills, Rollingwood and Lost Creek) is the most expensive Austin ZIP by median sale price at $1,869,828, up 10.0 percent year over year. By price per square foot, downtown 78701 leads at $676, followed by 78703 (Tarrytown) at $602 and 78746 at $560.
What is the cheapest ZIP code in Austin?
Inside Austin city limits, 78725 (Hornsby Bend) has the lowest median at $274,592, followed by 78705 (West Campus condos) at $320,977 and 78754 (Harris Branch) at $351,211. Across the full metro, 78648 (Luling) is lowest at $207,425.
Which Austin ZIP codes went up in value in 2026?
Seventeen of 72 metro ZIPs posted a higher trailing-twelve-month median than the year before. The largest gains were 78676 Wimberley (+15.5 percent), 78746 Westlake (+10.0 percent), 78717 Avery Ranch (+7.1 percent), 78757 Crestview (+6.9 percent), 78738 Bee Cave (+6.8 percent), 78724 Decker (+5.8 percent), 78739 Circle C (+5.3 percent) and 78737 Belterra (+5.0 percent).
Which Austin ZIP codes dropped the most in 2026?
Among ZIPs with meaningful volume, the steepest declines were 78612 Cedar Creek (-14.3 percent), 78756 Rosedale (-11.8 percent), 78652 Manchaca (-10.5 percent), 78747 Onion Creek (-9.7 percent), 78736 West Oak Hill (-9.6 percent), 78758 North Austin (-9.4 percent) and 78721 East Austin (-8.3 percent). Luling (78648) fell 16.4 percent on very low volume.
How many Austin ZIP codes have a median home price over $1 million?
Six: 78746 ($1,869,828), 78733 ($1,289,268), 78703 ($1,274,281), 78730 ($1,170,036), 78731 ($1,084,668) and 78619 Driftwood ($1,009,056). The five Austin ZIPs in that group form one arc from Tarrytown west through Westlake and north along Lake Austin to River Place.
Is Austin a buyer's market or a seller's market in late 2026?
The city as a whole is slightly seller-leaning at 4.93 months of inventory, but it splits sharply by ZIP. Circle C (78739, 2.4 months), Legend Oaks (78749, 3.0), Wells Branch (78728, 3.2) and Cedar Park (78613, 3.6) are seller's markets. Downtown (78701, 12.2 months), West Campus (78705, 12.4), Spicewood (78669, 10.9) and Riverside (78741, 9.6) are deep buyer's markets.
How much under asking do Austin homes sell for?
Citywide, homes closed 3.05 percent under final list price and 3.92 percent under original list price in the past twelve months, a combined discount of about 7 percent from the first ask. In 78703 and 78704 the combined discount is about 9 percent; in Circle C (78739) homes closed at 98.6 percent of asking.
Continue Exploring
Three places to go from here

ABOUT THE AUTHOR
Taylor Sherwood
Austin Real Estate Advisor · Echelon Property Group
Taylor Sherwood is a Certified Luxury Home Marketing Specialist (CLHMS) and top-performing Austin real estate advisor. He specializes in luxury residential properties, land development, commercial real estate, and investment property across Austin and the Texas Hill Country. With deep market expertise and a results-driven approach, Taylor helps buyers, sellers, and investors navigate Austin's most competitive real estate segments.
Related Reading
The 10 Most Expensive Neighborhoods in Austin (2026 Guide)
The richest neighborhoods in Austin ranked for 2026, from Rollingwood to Lake Austin waterfront. Median prices, school districts, and why the biggest sales never hit the MLS.
2026-07-23 • 12 min read
Austin Housing Market Forecast 2027: What the Data Says Happens Next
Austin's 2027 housing forecast: prices, mortgage rates, inventory and sales by price tier, three rate scenarios, and the Unlock MLS data behind each call.
2026-09-22 • 35 min read
The Best Time to Sell a House in Austin: 36 Months of Contract Data, and Why Luxury Runs on a Different Calendar
Three years of Unlock MLS data for Austin and the 78746/78703 luxury core show when buyers sign, when sellers flood in, and the one window that beats spring.
2026-10-12 • 20 min read
The Eanes Premium: What Austin Buyers Really Pay for Westlake Schools, and Whether It Holds in 2026
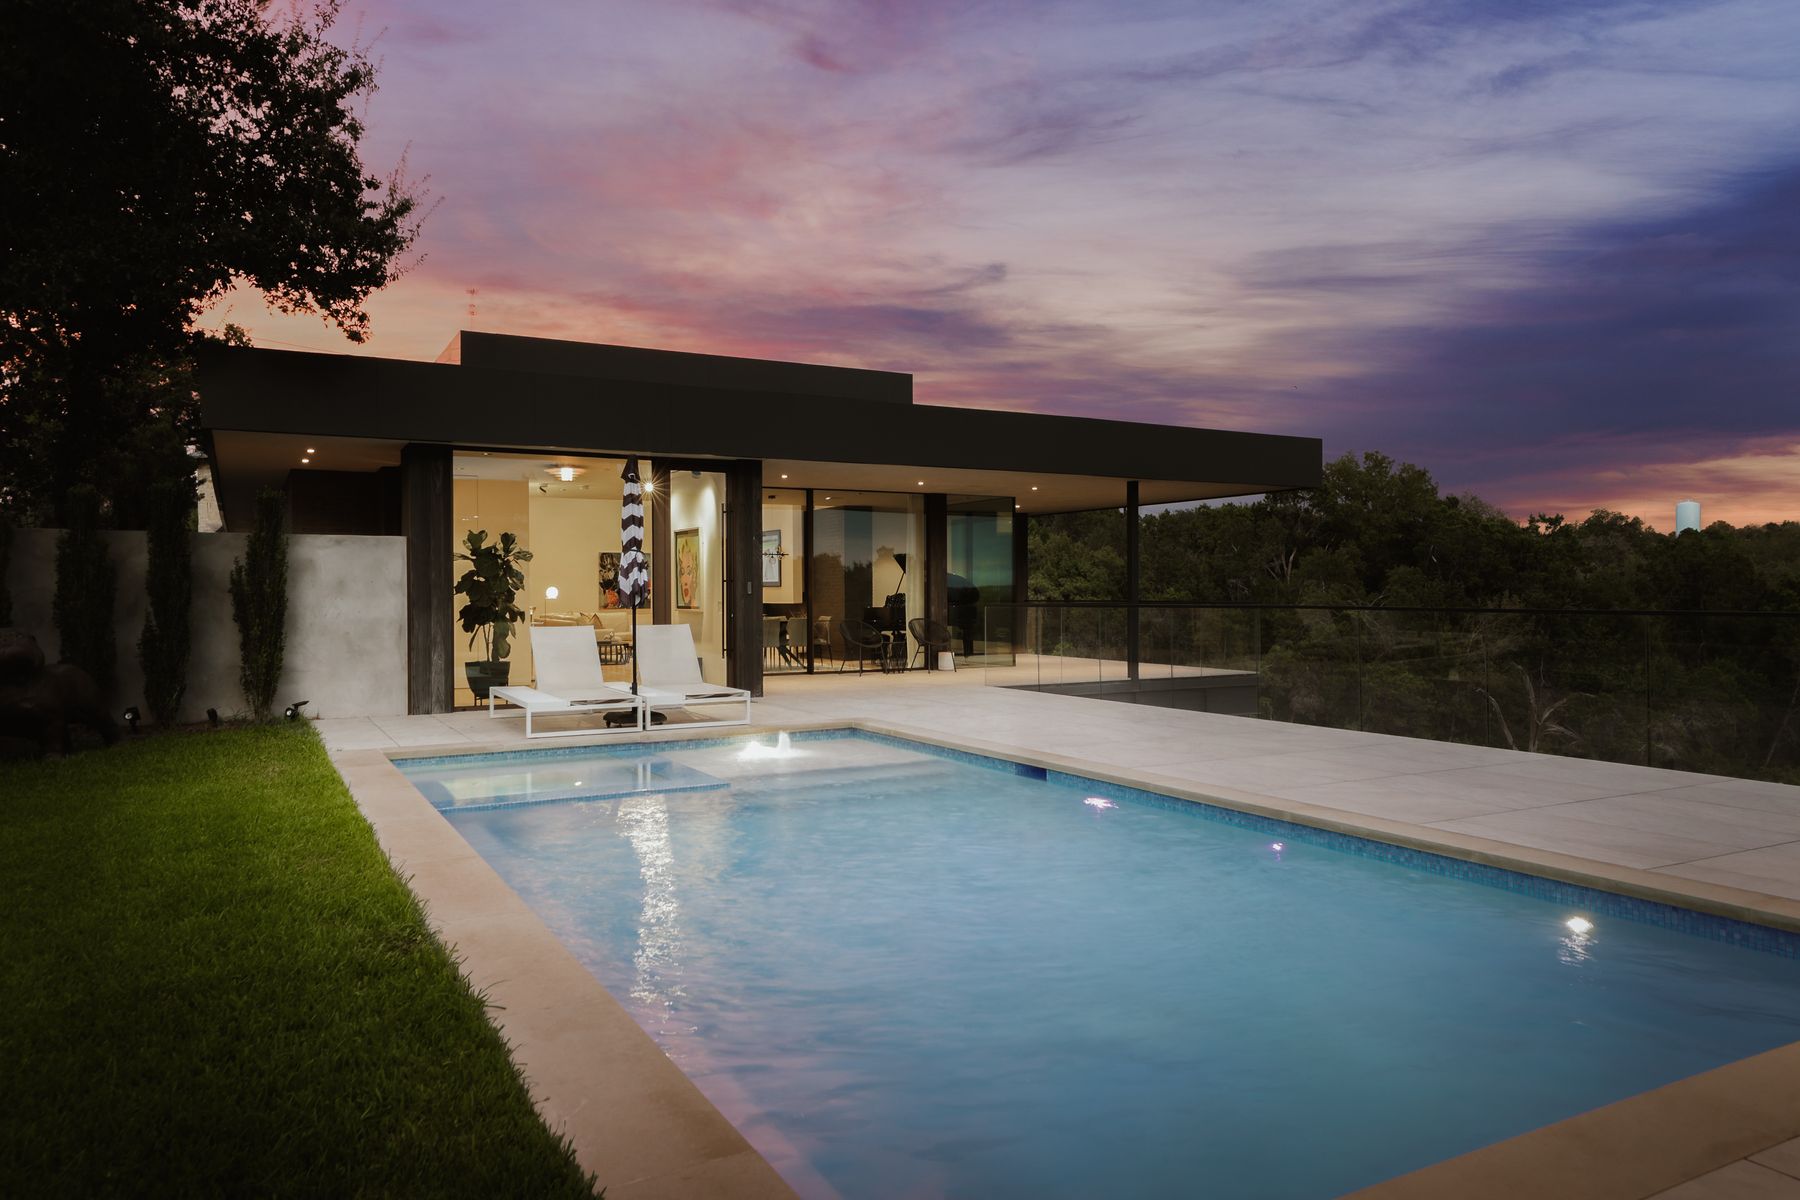
Eanes ISD homes sell at $563 a square foot, double the districts next door. The premium, the 2026 tax offset, and what held through the correction.
2026-09-14 • 24 min read